I will continue to post occasional Updates on the SARS-CoV-2 Outbreak on the previous page. Many others are doing this more quickly on Twitter, including @V2019N, @HelenBranswell, and @BNODesk, among others. The Center for Infectious Disease Research And Policy (CIDRAP) at the University of Minnesota has a summary of news about COVID-19 (the disease) and SARS-CoV-2 (the virus) that they update most days.
On this page, I will post links, summaries, and thoughts on some of the experts’ in-depth analyses and models of the SARS-CoV-2 outbreak, so that these long-lasting contributions can be found more easily. I’ve started this page by copying over several entries from the previous page that have proven to be especially prescient. I will add new items as I find them (and have time).
As a reminder, I’m neither a medical doctor nor an epidemiologist, but I study microbial populations from a basic-science perspective. So I have a pretty good sense of what the experts are saying, what is reliable within stated limits of uncertainty and assumptions, and so on. However, always keep in mind that this is a rapidly developing situation, so the data and their interpretation may change quickly.
What we know, what we don’t know, and implications for the incipient coronavirus pandemic (Feb 28): An excellent podcast interview with Marc Lipsitch, well worth spending 25 minutes to listen.
What countermeasures can we take to reduce the harm and disruption caused by this outbreak-turned-pandemic? (Feb 22): A superb thread from epidemiologist Marc Lipsitch about short-term and long-term strategies for dealing with the expanding SARS-CoV-2 outbreak and the COVID-19 disease that it causes. Full of ideas, advice, evidence, and concern for our individual and collective well-being.
Expert synthesis of where the situation stands (Feb 16): Neil Ferguson is an epidemiologist who models the dynamics of infectious diseases. In a technical, yet sobering, interview he works through estimates of various quantities relevant to the SARS-CoV-2 outbreak. He takes great care to acknowledge the uncertainties around his estimates. Here’s my effort to summarize what I understand him to say.
- The large number of cases on the Diamond Princess cruise ship shows how easily the virus spreads.
- The number of cases in Wuhan (city) and Hubei (province) appears to be plateauing, as predicted given the stringent quarantine imposed weeks ago.
- It’s hard to know what’s happening elsewhere in China because they only test people with travel history to Wuhan and Hubei, which would miss community transmissions and thus under-estimate the extent of the outbreak elsewhere.
- There are anecdotal reports of surges in pneumonia cases in other cities in China, consistent with under-testing and under-reporting of the new coronavirus.
- Regarding the severity of this disease, it’s difficult to say in part because different surveillance methods pick up different categories of severity.
- In China, only the most severe cases are routinely tested for the virus. Ferguson’s team estimates that about 18% of the severe cases in the Wuhan epicenter may die.
- That does not mean, however, that 18% of the people infected die because many have mild or even no symptoms, and they are not tested. Ferguson’s team estimates that only about 5% of infected people are actually tested in Wuhan. So combining this fraction with the severe cases, one would estimate an overall mortality rate across all infections (mild and severe) of roughly 1%.
- Another comparison group includes the ~300 cases of international travelers, where there have been 2 deaths (as of the time of this interview). However, there is a delay of ~3 weeks between diagnosis and death in the severe cases, and so that fraction needs to be adjusted to account for this delay. When accounting for this delay, Ferguson estimates that the mortality rate will eventually prove to be between 2% and 5% in this group. Once again, however, these cases are focused on travelers who already showed observable signs of illness when they entered a country, so this rate will also be higher than for other infections.
- To adjust for this bias in detection as a function of severity, one needs to estimate the fraction of all travelers from the affected areas who are infected. To estimate this infection prevalence, Ferguson uses data obtained from the evacuation flights, where travelers who returned to their home countries were systematically quarantined and tested for the coronavirus, whether or not they showed symptoms. From these data, Ferguson estimates there were 3 to 4 times more infections than discovered when screening travelers. This means two things. First, the mortality rate estimated from travelers who show symptoms is once again too high by several fold, If all infections were taken into account, the overall death rate is something on the order of 1%. Second, it means that many countries probably have SARS-Cov-2 transmissions occurring undetected in some communities.
- Given all of the statistical noise in the data, Ferguson says that the uncertainty around these estimates of 1% mortality is about 4-fold in each direction. So bottom line, he thinks the true mortality rate lies between about 0.25% (1 in 400) and 4% (1 in 25).
- The lower value would be similar to the pandemic influenza years of 1957 and 1968, while the high end would be more comparable to the 1918 pandemic.
- The potential scope of the pandemic in terms of how many people will be infected is also difficult to predict. Going from past experience with influenza pandemics, Ferguson suggests that roughly half of the population might be infected in the first year, when one includes both those people who become ill and those with mild or no symptoms.
- Despite these uncertainties, Ferguson explains that such numbers are valuable for countries and their health-care systems to formulate appropriate plans to deal with this “serious threat.”
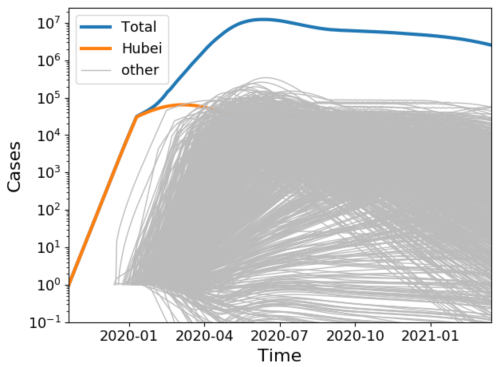
Model examining possible global spread based on numerous seeding events (Feb 9): Biophysicist Richard Neher updates his graphical presentation of the increase in COVID-19 cases in Hubei and elsewhere in China. The good news is that the rate of increase is declining. That’s expected given the extreme quarantine measures taken in Wuhan and other cities. However, it’s also clear that many smaller outbreaks have been seeded elsewhere in China and other countries. Some of these outbreaks will be contained with expertise and diligence, but others will likely escape notice until they become too large to contain. With travel, these outbreaks can seed new outbreaks, and so on, as discussed and illustrated by Trevor Bedford. (See Seeding events explained and illustrated conceptually below.) Neher has run simulations to get a handle on this scenario, using his educated guesses for the relevant parameters. In brief, he assumes there are many such outbreaks already underway, but running 2 or 3 months behind the Wuhan outbreak. With increased awareness among the public and health-care workers, many of these outbreaks will grow more slowly than Wuhan did and be contained. And even those that grow large will, like Wuhan, slow down once they become very large due to quarantines and other social distancing. Nevertheless, Neher finds it’s quite possible to envision total global cases in several months that dwarf those seen in Hubei by 100-fold, even while it looks as though (as it does now) that the rate of increase is declining. I’ve posted a screen shot of this scenario below.
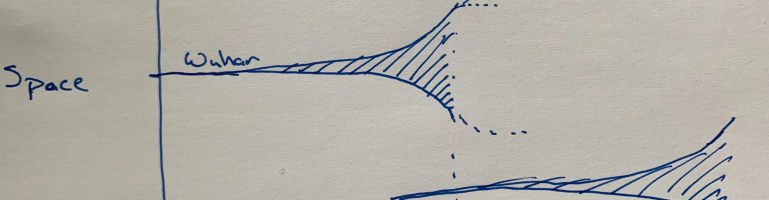
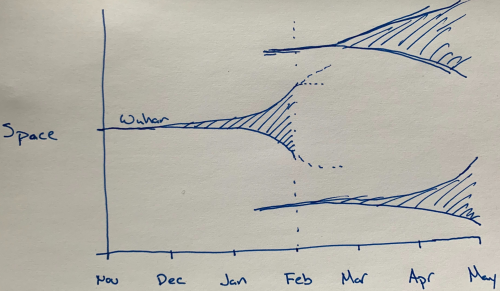
Seeding events explained and illustrated conceptually (Feb 8): A short, and excellent, thread from infectious disease epidemiologist Trevor Bedford explaining why the next several months are so critical for the potential for global spread of the SARS-CoV-2 virus. In essence, the Wuhan outbreak seeded new outbreaks in China and elsewhere. We now know that the Wuhan outbreak was not contained until it became huge. (See, for example, my simple estimate from 27 January that there were already on the order of 100,000 infected people in Wuhan). Not all of these infections led to “cases” in the sense of hospitalized patients or even those that saw a doctor. That’s because most infected people have only mild symptoms, but it appears that these mild infections can still contribute to the virus’s spread. Importantly, all of the newly seeded outbreaks have to be much better contained to keep things in control. Bedford nicely shows this basic idea in his hand-drawn picture, which I’ve reproduced here.
Model with variable, overdispersed transmission (Feb 14): Kyra Grantz, Jessica Metcalf, and Justin Lessler tackle an apparent dilemma in the epidemiological data on the spread of the coronavirus SARS-CoV-2. On the one hand, the value of R0 appears to be greater than 2 based on data from China, meaning that each infected person, on average, infects 2 or more people. On the other hand, most infected travelers do not seem to have set off significant transmission chains outside of China (although there certainly have been some secondary infections). How can these patterns be reconciled? In short, the resolution may lie in the variability between infected persons–or the settings when they are most infectious–in their propensity to infect others. So, for example, if most infected people start to feel a bit sick and stay home, but a few still feel well enough to go to a conference, then the average number of transmissions over all cases might be 2, but the variation in the number of transmissions could be quite high. In that case, most introductions of an infected traveler into a new community may lead nowhere (and appear inconsistent with a high rate of spread), but the occasional introduction could lead to a much larger (and potentially hard to contain) outbreak. [Updated: This is what seems to be happening now in South Korea, Japan, Italy, and Iran.] In this scenario, it becomes harder to control the spread of an epidemic unless one can systematically identify the situations where such “super-spreading” events tend to occur; if one can identify and prevent those situations, however, then control of the outbreak may be more feasible. Lessler clearly explains and illustrates the ideas in a Twitter thread.
Model examining possible effects of seasonal variation in transmission (Feb 17): Richard Neher, Emma Hodcroft, and co-authors have posted a paper (not yet reviewed by other experts) where they analyze the possible effects of seasonality on the extent of the SARS-CoV-2 outbreak. Their model assumes that the virus, owing to its transmissibility and the global mobility of people, will eventually become established globally. (That’s not certain at this time, but many experts think it is likely.) They begin by noting that four other coronaviruses that circulate in the human population (typically causing symptoms similar to the common cold) are more prevalent in the winter and early spring. The good news from their model is that this seasonal variation in transmission should slow the spread of the new coronavirus in the coming months. The bad news, though, is that SARS-CoV-2 infections are likely to reach a peak next winter (2020/2021). At least that provides more time for health-care systems to prepare. They also emphasize that health officials and others should not assume the virus is under control based on diminishing case counts, because seasonality (along with quarantines and other social-distancing efforts) may give a false impression that the virus has been brought under control. Hodcroft has a nicely illustrated and explained Twiiter thread that summarizes this work. A few hours later, Neher posted another excellent thread on this work.
Different measures of an infectious disease’s mortality (Jan 30): Epidemiologist Maia Majumder provides a clear and concise explanation of the different ways of measuring and describing the “deadliness” of infectious diseases. As importantly, she explains why the different estimates change over time. In the case of the population mortality rate, that will tend to increase as an outbreak grows in size, before eventually reversing course once an outbreak has been brought under control. By contrast, the case fatality rate (CFR) reflects the fraction of diagnosed infections that cause death. This latter rate is subject to an early spike because the earliest cases are often the most severe. Also, increased awareness and testing of less severe cases tends to increase over time. Both of these factors mean the CFR typically declines as an outbreak progresses. On the other hand, many serious cases (as reported for COVID-19 by Chinese health authorities) have not yet resolved. In short, the CFR remains poorly understood at this time. Then, too, there are some people who get an infection, including the SARS-CoV-2 virus, but with no or minimal symptoms, and so they are not diagnosed, These subclinical cases can be discovered later on when populations are surveyed serologically, allowing a further, lower estimate of the fraction of total infections (those discovered later as well as those discovered clinically) that cause death. Dr. Majumder also reminds us that different subpopulations (such as those with chronic diseases) may face different risks.
Why the case fatality rate changes in unexpected ways (Feb 18): Adam Kucharski explains why estimating the case fatality rate for COVID-19 is complicated, and why the rate can appear to increase when the outbreak is slowing down.
Phylogenetic analysis of the SARS-CoV-2 genomes from around the world (frequently updated): As genome sequences of the novel coronavirus become available, Trevor Bedford and others that run the Nextstrain database update their phylogenetic analysis that shows the genetic relatedness of the virus samples.
Origin of the SARS-CoV-2 virus (Feb 17, Feb 1, Feb 20): In one thread, Trevor Bedford shows that a virus from a bat is the closest relative to the SARS-CoV-2 virus that has been isolated and sequenced to date, and not any of the viruses isolated from pangolins as some others had suggested. However, Bedford leaves open the possibility that pangolins or other animals may have served as an intermediate hosts, but any such transitional viruses have not yet been found and sequenced. In a second thread, Bedford debunks the claim that SARS-CoV-2 has unexpected genetic material from or similarity to HIV. In a third thread, Bedford explains why the coronavirus outbreak that began in Wuhan almost certainly began as a zoonotic spillover, rather than escaping from a government laboratory.
Links to my previous posts on the SARS-CoV-2 coronavirus outbreak
Updates on the SARS-CoV-2 Outbreak (Jan 30) & continuing
Developing News on the Wuhan Corona Virus, nCoV2019(Jan 29)
Quick-and-Dirty Estimate of Number of nCoV2019 Infections in Wuhan (Jan 27)

Pingback: Updates on the SARS-CoV-2 Outbreak | Telliamed Revisited
Pingback: Global Dynamics of Coronavirus Spread | Telliamed Revisited